Remittances to Mexico fell roughly 4.6 percent in 2025 due to a combination of factors related to demographic changes and migration enforcement. Other contributors to the change include small increases in the principal amount remitted, a reduction in transfers from non-Mexicans, and the use of other money transfer methods.
While transfers from the U.S. to Mexico dropped, transfers from the U.S. to all other receiving countries grew by two digits, indicating that regional economic factors like unemployment, inflation, or wages (which would have a similar effect in Mexico as in the rest of Latin America) do not explain the change. Overall, the fall primarily rests on the decline in the number of Mexican senders, which was insufficient to counteract the modest increase in average remittances.
The continuation of guest worker programs under the H-2A and H-2B visas mitigated an even larger decrease. These types of programs help mollify the intention to migrate in economically depressed countries by increasing remittance flows, which in turn create more opportunities for investment in the local economy and make people reconsider migrating.
FIGURE 1: GROWTH OF REMITTANCES TO MEXICO, 2005-2025
TABLE 1: REMITTANCES FROM THE U.S. TO SELECT LATIN AMERICAN AND CARIBBEAN COUNTRIES, 2024-2025
|
Country |
2024 |
Growth |
2025 |
Growth |
|
Colombia |
$11,848 |
17.00% |
$13,036 |
11% |
|
Dominican Republic |
$10,756 |
4.00% |
$11,866 |
11% |
|
Ecuador |
$6,574 |
20.60% |
$7,494 |
14% |
|
El Salvador |
$8,480 |
3.60% |
$9,979 |
18% |
|
Guatemala |
$21,510 |
8.70% |
$25,530 |
19% |
|
Haiti |
$3,755 |
9.00% |
$4,478 |
19% |
|
Honduras |
$9,743 |
3.70% |
$12,212 |
25% |
|
Jamaica |
$3,492 |
0.20% |
$3,560 |
3% |
|
Mexico |
$64,745 |
1.60% |
$61,791 |
-4.6% |
|
Nicaragua |
$5,243 |
12.50% |
$6,101 |
20% |
|
Nine countries |
$146,146 |
5.30% |
$156,048 |
6.78% |
|
Total remittance flows from the U.S. to Latin America (85% of all remittance flows to Latin America) |
$160,814 |
A Difference in the Remitting Cycle
Data on money transfer patterns in the 21st century indicate that the average migrant sender is staying longer in the United States and sending money for larger periods of time: remitters now spend up to 30 years sending money to relatives.
This trend is particularly relevant to Mexico because Mexican immigrants have, on average, been in the United States for 26 years. U.S. Census and migrant survey data shows that the number of Mexican migrants who stopped sending money after 30 years in the U.S. represents 5 percent of all Mexican remitters.
Every year that a migrant reaches 30 years (the lifetime of remittance sending), the number of senders drops by 500,000. By contrast, new migrants who send for the first time (young migrants who enter the US labor force, not migrants who arrived for the first time) are only 0.5 percent, that is, 1/10 of that number. In the case of Mexico, the net number between those dropping and those sending for the first time is negative.
As shown in the table below, this is not the case for most non-Mexican migrants, the majority of which have been in the U.S. for a shorter period of time (corresponding to the large migrant influx from 2018 to 2024). As a result, the percentage of non-Mexican remitters that have been sending money for at least 30 years is far lower than that of Mexican remitters, averaging 0.5 percent of all migrants, compared with 5 percent among Mexican migrants.
TABLE 2: DEMOGRAPHIC CHARACTERISTICS OF REMITTANCE SENDERS
|
Country |
Percent of remitters aged 16-17 |
Remitters joining the market |
Percent of remitters who have been sending money for 30+ years |
Remitters leaving the market |
Net change |
|
Mexico |
0.4% |
36,313 |
5.1% |
569,521 |
-533,208 |
|
El Salvador |
0.8% |
9,028 |
4.2% |
57,320 |
-48,292 |
|
Dominican Republic |
1.0% |
9,360 |
4.3% |
40,800 |
-31,440 |
|
Guatemala |
1.4% |
21,645 |
2.6% |
79,097 |
-57,452 |
|
Colombia |
0.5% |
4,812 |
3.3% |
43,848 |
-39,036 |
|
Honduras |
1.6% |
13,102 |
1.9% |
48,193 |
-35,091 |
|
Ecuador |
0.8% |
4,371 |
2.8% |
32,976 |
-28,605 |
|
Peru |
0.3% |
1,112 |
4.0% |
19,464 |
-18,352 |
|
Venezuela |
1.4% |
14,748 |
0.7% |
24,203 |
-9,455 |
|
Nicaragua |
0.8% |
4,389 |
2.0% |
12,734 |
-8,345 |
|
Jamaica |
0.60% |
4,800 |
4.10% |
32,800 |
-28,000 |
|
Haiti |
0.50% |
5,000 |
3.30% |
33,000 |
-28,000 |
Source: U.S. Census data and author’s estimates. These figures do not include deportations or new migrants arrivals.
Declining Migration in 2025 and the Flow of Deportations
As was the case in 2025, a sudden reduction in irregular migration severely reduces remittance flows. The wave of migration to the U.S. lasting from 2018 to 2024 sustained the volume of money transfers in spite of demographic changes (that is, the difference between ‘dropout’ senders and new senders stayed relatively constant), but in 2025, the smaller number of new arrivals and entries did not compensate for the number of remitters who stopped sending.
In the case of Mexico, remittance growth has been positively correlated with new migration, particularly through H-2A and H-2B visas, which have accounted for more than 350,000 workers annually since 2020, as well as through irregular migration. However, the reduction in irregular migration since 2024 has affected both migration and remittance flows. While the number of guest worker visas has remained relatively stable, Mexican irregular migration has not—see Table 3.
TABLE 3: MEXICAN MIGRATION IN NUMBERS, 2010-2025
|
Year |
Irregular Migration |
Non-Immigrant Visas |
Legal Migration (LPR) |
||
|
Border Apprehensions |
Irregular Entries* |
BBBCC & BBBCV |
H-2A |
||
|
H-2B |
|||||
|
2010 |
404,365 |
351,798 |
971886 |
88,994 |
66,956 |
|
2015 |
267,885 |
233,060 |
1,166,668 |
156,369 |
82,323 |
|
2018 |
252,267 |
219,472 |
1,032,467 |
209,838 |
79,678 |
|
2019 |
252,403 |
334,906 |
1,106,852 |
222,694 |
54,780 |
|
2020 |
362,251 |
131,270 |
662,536 |
244,109 |
29,242 |
|
2021 |
725,008 |
91,828 |
512,889 |
310,393 |
40,784 |
|
2022 |
810,679 |
215,974 |
1,244,482 |
360,496 |
42,823 |
|
2023 |
743,938 |
370,581 |
1,000,000 |
369,172 |
42,823 |
|
2024 |
630,202 |
189,060 |
1,776,152 |
371,000 |
43,679 |
|
2025 |
170,000 |
20,600 |
1,994,072 |
360,000 |
44,553 |
Source: U.S. Visa Statistics, U.S. Department of Homeland Security. Data does not include H1B or ‘Nafta’ visas. Note that just over 1 percent of tourist visas become visa overstayers. *Irregular unauthorized entries are based on DHS estimates of ‘gotaways’ and non-impactable aliens.
FIGURE 2: REMITTANCES TO MEXICO AND MIGRATION TO THE U.S., 2018-2025 (AUTHORIZED, H-2A AND H-2B, AND UNAUTHORIZED) 

Increasing deportations (close to 160,000 in 2025) also contributed to the decline in remittance transfers. Unlike deportees in previous years, over 90 percent of Mexican deportations in 2025 were of remitters and people living in the U.S. for more than 4 years.
This number (160,000 deportations), along with at least 200,000 fewer new migrants and a drop in the number of remitters already living in the U.S. (-500,000), represents a loss of US$3 billion in remittances that were not sent or received in 2025.
A Relatively Unchanged Average Principal Remitted
Another key contributor to current remittance trends is that Mexican migrants did not increase their principal remittances to the same extent as their Latino migrant counterparts. The fear of deportation played a strong role in the increase across Latin America and the Caribbean. The amount sent in 2025 was 25 percent greater than the average principal remitted in 2024, primarily due to migrants’ fear of being deported and no longer being able to care for their families.
By contrast, Mexicans have been sending a higher principal amount for years and would have struggled to send more—a barrier that other nationalities will experience in the near future. The average principal remitted among Mexicans in 2024 was $490, which rose to $520 in 2025; a much lower increase compared to other migrant remitters.
The increase in the average amount sent did not even compensate for peso appreciation during that year, and its accumulated value remained lower than in other periods in which migrants adjusted their transfers to accommodate for changes in foreign currency exchange rates.
FIGURE 3: AVERAGE MIGRANT REMITTANCE SENT BY NATIONALITY, 2024-2026
FIGURE 4: PRINCIPAL AMOUNT REMITTED, 2015-2025

Alternative Explanations of the Decline
Some businesses and practitioners point to two additional factors explaining the drop in remittances to Mexico in 2025. One is that a fraction of transactions originating in the U.S. and received in Mexico were non-Mexican nationals helping families or relatives en route to the U.S.
The number of migrants passing through Mexico in 2024 was nearly 2 million; in 2025, this number decreased by 80 percent. Some of those who remained in Mexico temporarily may have relied on remittances from the U.S. Although it is difficult to ascertain how many transactions this cohort conducted, reports from money transfer companies indicate that remittances received by non-Mexican nationals in Mexico fell in 2025.
Other industry practitioners add that some transactions remitted through the Mexican payment clearinghouse SPEI (Sistema de Pagos Electrónicos Interbancarios) go unreported. However, these would be few in number and small in value, given that the average daily transaction in Mexico is 3,000 pesos, just one-third of what a Mexican remitter sends. Over 90 percent of daily transactions in Mexico are below 8,000 pesos. One key effect is that the increase in direct remittance deposits may be driven by the popularity of SPEI.
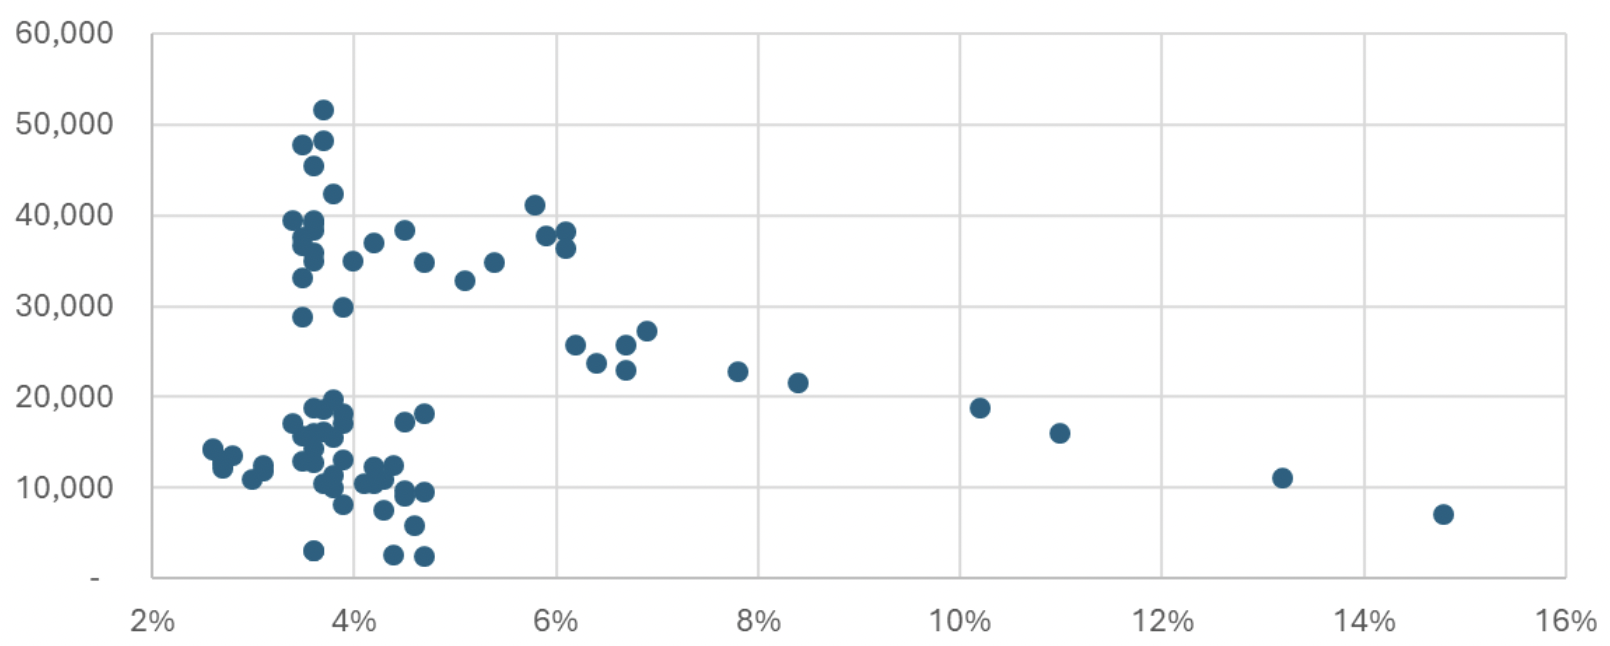
One final explanation for the drop in remittances points to the effect of economic conditions, such as unemployment; however, this argument ignores the discrepancy between Mexico and Central America. Any macroeconomic factor would have a similar impact on all other nationalities, given that Central Americans and Mexicans generally share the same occupations. The data does show a negative correlation between unemployment rates, migration rates, and the principal amount remitted. Therefore, it would be difficult to attribute the fall in Mexican remittances during that period due to increases in unemployment.
In Conclusion
A combination of factors led to an almost 5 percent decline in remittances from the United States to Mexico; this decline, worth more than US$3 billion, affected close to half a million households (including those who would have migrated, with a median of 120,000 emigrants).
As the Mexican migrant population ages and migration continues to decline, future remittances may not increase by more than 2 percent unless formal guest worker programs continue to expand. The 1.4 percent increase in remittances to Mexico in the first quarter of 2026 is explained by a 3 percent increase in H-2A visas, while the average amount remitted remains at a 1 percent growth rate.
Remittances have an important negative effect on the intention to migrate; our research shows that those who receive remittances tend to migrate less. Inside of the United States, the demand for foreign labor will be affected by short-term labor shortages due to reduced migration rates.
TABLE 4: AN APPROXIMATE CALCULATION OF CHANGES IN REMITTANCE PATTERNS TO MEXICO
|
Type of remitter |
2024 |
2025 |
|
Remitters resulting from migration (unauthorized migration, guest worker visas, legal migration) |
564,848 |
415,682 |
|
Remitters resulting from demographic changes |
-450,000 |
-533,208 |
|
Remitters deported |
-25,000 |
-160,192 |
|
Non-Mexican nationals |
150,000 |
|
|
Unreported transactions (SPEI, unlicensed transfers) |
-50,000 |
-125,000 |
|
Net remitters |
189,848 |
-402,718 |
|
Principal remitted (US$) |
6,250 |
6,750 |
|
Volume contribution to year |
$1,186,549,590 |
-$2,718,349,479 |
FIGURE 5: MEXICO’S PRINCIPAL RECEIVED AND LATINO UNEMPLOYMENT, 2015-2025
FIGURE 6: H-2A/H-2B VISAS TO MEXICANS AND U.S. UNEMPLOYMENT, 2018-2025

FIGURE 7: IRREGULAR MIGRATION AND UNEMPLOYMENT, 2018-2025
